Acquire new customers with a toll-free phone number for your Shopify store.
From the Little Stream Software blog
Alfons was asking about how the cumulative cohort option in Repeat Customer Insights works.
When you enable Include Previous Months (cumulative), each column adds the ones from the left so there's a running total.
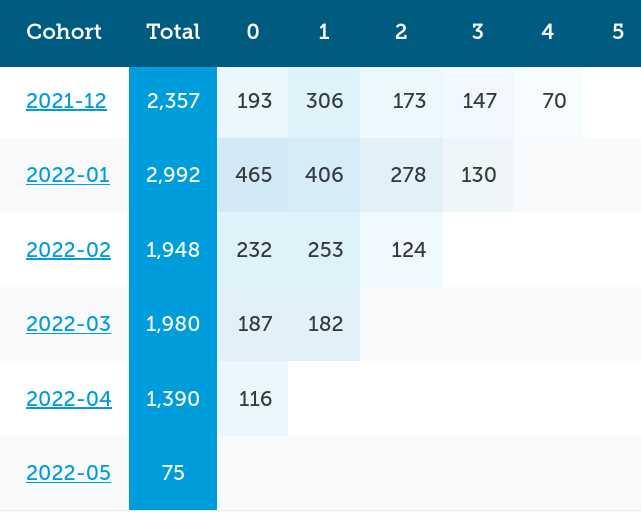
For example, lets use the regular cohort analysis. If you look on the row 2022-01, when Include Previous Months is off you'll see:
- 465 customers ordered again in 2022-01 (column 0)
- 406 customers ordered in 2022-02 (column 1)
- 278 customers ordered in 2022-03 (column 2)
Turning on Include Previous Months the values change to:
- 869 customers ordered in 2022-01 (column 0) same
- 406 customers ordered in 2022-02 (column 1) same, it's the first real month so no previous months to rollup
- 612 customers ordered in 2022-03 (column 2), different. There's 406 customers who ordered in the last month (column 1) plus 206 new ones this month
Each view of the data gives you different analyses depending on what you're looking for. Looking at both, you can also spot some things that neither view would tell you directly.
The cumulative view let's you see how many customers ordered at least a second time since the first month they ordered.
(There's also a Revenue-based cohort view in the app that works similarly except it tracks the total revenue spent for each cohort in each month)
Eric Davis